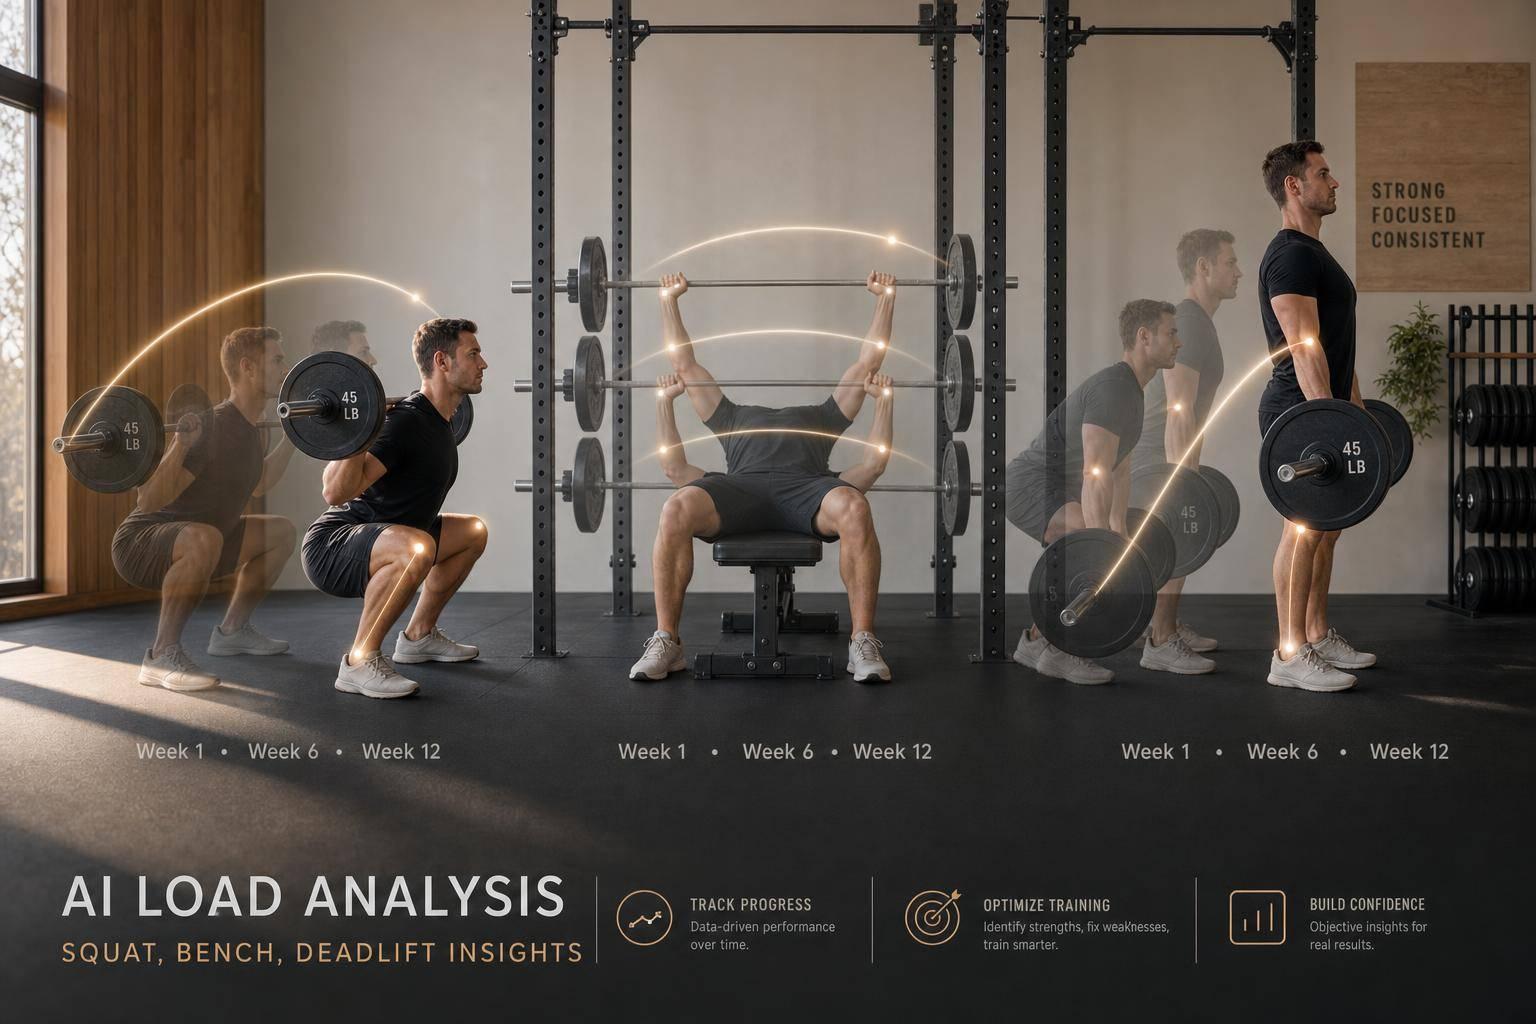
AI Load Analysis: Squat, Bench, Deadlift Insights
If I had to boil this down to one point, it’s this: AI is best for spotting repeat lifting patterns across squat, bench press, and deadlift - not judging one rep by itself.
I’d use it to watch bar speed, joint loading, and left-right differences. The research shows that load shifts as weight gets heavier: squats often become more hip-driven, bench reps can drift toward the shoulders, and deadlifts tend to slow down with more trunk lean. Studies also show some big numbers, like patellofemoral joint forces reaching 26.7 ± 4.3 times body weight at 90% 1RM.
Here’s the short version:
- Squat: stance, bar position, depth, and fatigue change where force goes
- Bench press: grip width and fatigue change bar path and lockout
- Deadlift: heavier sets often mean slower reps, more forward lean, and more bar drift
- Best training use: track trends over 6 to 12 weeks, not day-to-day noise
- Useful velocity-loss cutoffs: 20% for squat, 25% for bench, 15% for deadlift
- Main limit: video tools are helpful for screening, but they are less precise than lab gear
I’d treat video-based AI as a way to make coaching feedback more objective. It can show patterns that are easy to miss, but camera angle, blocked joints, and poor footage can still throw off the read.
| Lift | Main AI Checks | Common Change Under Heavy Load | Practical Cutoff |
|---|---|---|---|
| Squat | Torso angle, bar speed, side-to-side balance | More hip demand, more forward lean | 20% velocity loss |
| Bench Press | Bar path, lockout timing, upper-body balance | Bar drifts toward shoulders | 25% velocity loss |
| Deadlift | Bar speed, trunk position, bar drift | Slower reps, more trunk flexion | 15% velocity loss |
If I were using these tools in training, I’d keep the setup the same each session, review patterns over time, and use the data to support coaching - not replace it.
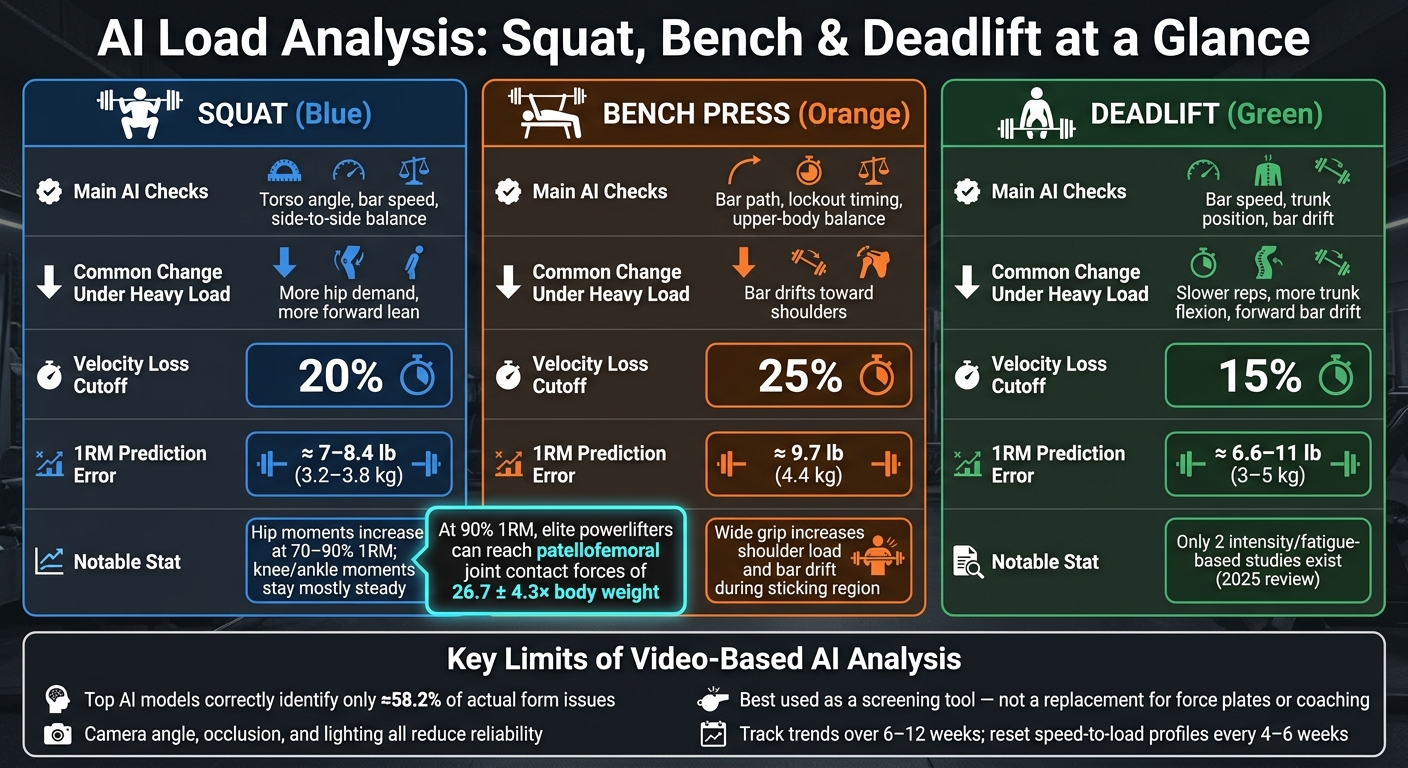
AI Load Analysis: Squat, Bench & Deadlift Key Metrics Compared
AI Methods and Metrics: What the Research Covers
Key inputs: video, force data, and wearable sensors
A lot of recent studies lean on three main data sources: camera video, force-plate data, and wearable sensors. Researchers use them together to estimate how load shifts during each rep. From there, those signals feed the metrics used to compare one lift to the next.
Standard 2D video can do more than most people expect. With pose-estimation tools like MediaPipe or MoveNet, researchers can track joint positions and barbell paths frame by frame [3][6]. Hidden Markov models can also spot technique changes that a normal visual check might miss, especially at loads equal to 50% to 75% of body weight [3].
Wearables add another layer. The 17-sensor Xsens MVN Link system records joint angles, segment trajectories, and movement timing across the body [4]. When researchers added subject-specific features, movement-quality scoring went from 86.5% to 94.8% [4].
Velocity tools matter too. Linear transducers measure mean and peak concentric velocity with strong reliability. Some smartphone apps are now close to motion-capture systems for velocity tracking. In one case, an app recorded every rep with RMSE of 0.01 to 0.04 m/s, while other apps missed up to 175 of 589 reps [5].
Key outputs: joint moments, asymmetry, and bar velocity
Even though the inputs vary, most methods come back to the same three outputs: joint loading, left-right imbalance, and bar speed.
Net joint moments and joint contact forces show how stress is shared across the hip, knee, and ankle during a lift. That matters a lot when loads get heavy. At 90% of 1-rep max, elite powerlifters can reach peak patellofemoral joint contact forces of 26.7 ± 4.3 times body weight [7]. Put simply, heavy concentric work can create huge forces at the joints, which is why load management matters so much.
Bar velocity is the easiest metric to use in real time. Mean and peak concentric velocity usually drop as load goes up, and the sticking region tends to last longer under heavier loads and fatigue [1]. If you've ever watched a rep slow to a crawl halfway up, that's the pattern these systems are measuring.
Left-right asymmetry rounds out the main outputs by tracking force or moment differences between sides. Taken together, joint loading, bar velocity, and asymmetry give researchers a repeatable way to describe how load moves through each lift. These are the outputs the next section uses to separate squat, bench press, and deadlift load patterns.
AI Deadlift Form Analyzer | Real-Time Bar Path & Biometric Tracking with YOLO
Load Distribution Findings by Lift: Squat, Bench Press, and Deadlift
These metrics show that each lift spreads force in its own way.
Squat: stance, bar position, depth, and left-right balance
AI load analysis shows that squat mechanics shift with stance, depth, and intensity. At 70% to 90% 1RM, hip moments go up while knee and ankle moments stay mostly steady [2]. Stance changes the pattern even more: a high-bar, narrow stance puts more stress on the knees, while a low-bar, wide stance moves more of that demand to the hips [8].
Depth adds another layer. Deeper squats lead to higher knee extensor net joint moments [1]. Fatigue can also make movement less steady, with more variation in knee-hip and trunk coordination, especially in the sticking and acceleration regions [1].
The bench press shifts attention away from lower-body load sharing and toward bar path control and upper-body symmetry.
Bench press: grip width, bar path, and uneven lockout
In the bench press, AI tracks how grip width and fatigue affect bar path and joint demand. As intensity climbs, the bar tends to drift toward the shoulders [1]. AI systems can follow that shift across the acceleration, sticking, maximum strength, and deceleration regions [1].
Grip width plays a big role in where the stress ends up. A narrow grip puts more load on the triceps and elbows, while a wide grip shifts more of it to the pectorals and shoulders. Wide grips also increase shoulder load and make shoulderward bar drift more likely during the sticking region [1]. Near failure, AI can spot uneven lockout by picking up changes in segment coordination.
| Grip Type | Primary Muscle Emphasis | Shoulder Load | Elbow Load | Common AI-Detected Bar Path Patterns |
|---|---|---|---|---|
| Narrow | Triceps / Front Delts | Lower | Higher | Longer vertical travel; elbows tucked close to torso |
| Medium | Balanced (Pectorals/Triceps) | Moderate | Moderate | Standard J-curve or S-curve; moderate horizontal displacement |
| Wide | Pectoralis Major | Higher | Lower | Elbow flare; shorter range of motion; bar drifts toward shoulders under fatigue |
The deadlift shows many of the same AI signals, but the research base is thinner and the lift is more sensitive to trunk position and bar drift.
Deadlift: conventional vs. sumo, spinal loading, and bar drift
There are fewer deadlift studies, but the data still point to clear load and bar-path changes as intensity rises. Deadlift research is thinner than squat or bench data; a 2025 review found only two intensity- or fatigue-based studies, which limits stance-specific conclusions [1].
Heavier loads lead to longer concentric phases, lower mean and peak bar velocity, and higher peak force production [1]. As intensity or fatigue goes up, lifters also tend to show more trunk flexion and forward lean, which can increase horizontal bar drift [1].
The split between conventional and sumo follows a familiar pattern. Conventional pulls place more demand on the lumbar spine and hips. Sumo setups reduce lumbar load by allowing a more upright torso, but they increase hip abductor and knee demands because of the wider stance.
Putting the Research to Work in Training
Using AI feedback to adjust setup, load, and technique
Use AI feedback with a little patience. Don't change your setup or technique because of one weird rep. Act when the same pattern shows up across multiple sets.
Bar-speed loss is a practical way to manage fatigue. Good cutoffs are 15% for deadlifts, 20% for squats, and 25% for bench press [12]. If you want to estimate 1RM without going all-out, a two-point method can help: do one set at about 45% of 1RM and another at about 85% of 1RM. In trained lifters, that method can estimate squat 1RM with about 7–8.4 lb (3.2–3.8 kg) of error [11].
Look at the full lift pattern, not one rep in isolation, when deciding whether to keep a set going, cut it, or fix something. For example, more torso lean at 85–90% 1RM in the squat is often a response to heavy load, not a mistake [2]. It also helps to review changes over 6–12 weeks instead of chasing day-to-day noise. Reset speed-to-load profiles every 4–6 weeks, or after a strength change of about 5% [11][13]. And deadlift progress doesn't always move in a smooth weekly rhythm. It often shows up in jumps, unlike squat or bench, which tend to change more steadily week to week [13].
Those cutoffs make more sense when video shows that bar path and torso position are still steady.
| Exercise | Velocity Loss Cutoff | 1RM Prediction Error |
|---|---|---|
| Squat | 20% | ~7–8.4 lb (3.2–3.8 kg) |
| Bench Press | 25% | ~9.7 lb (4.4 kg) |
| Deadlift | 15% | ~6.6–11 lb (3–5 kg) |
Table values summarize velocity thresholds [12] and 1RM error estimates [11].
Where video-based coaching tools fit, including CueForm AI
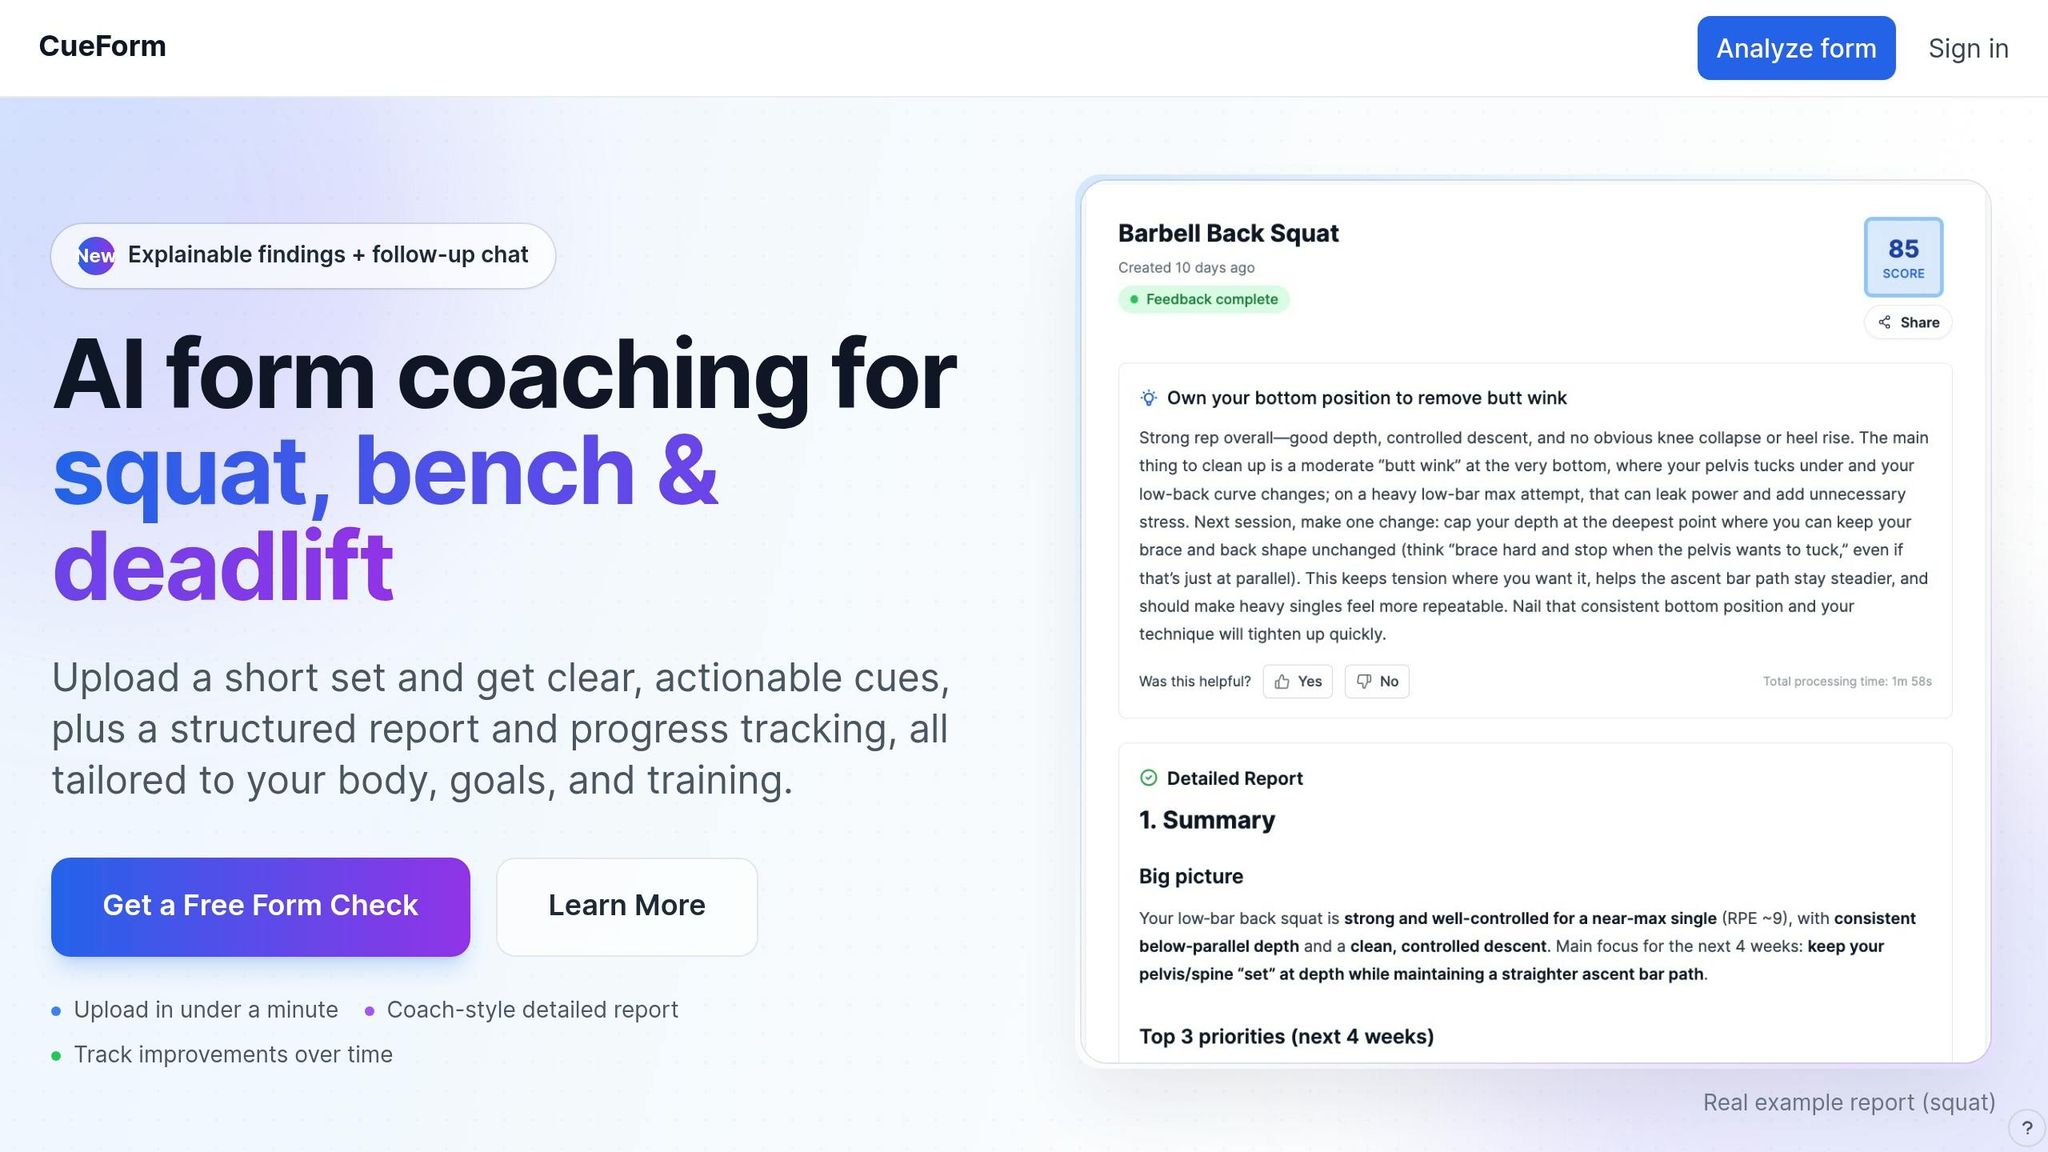
Video-based AI tools are useful because they show what your body is actually doing, not just what it feels like it's doing. That's a big deal in training. A squat can feel even and still drift to one side. A bench rep can feel straight and still wander. Under fatigue, early spinal rounding in the deadlift can sneak in before you notice it yourself.
That's where tools like CueForm AI fit. You upload squat, bench, or deadlift video, get cues based on the load signals the system sees in your footage, and use the AI coach chat to adjust the next rep. Still, the output is only as good as the video. Camera angle and occlusion matter a lot. Keep the camera in the same position across sessions, because angle changes can look like technique changes even when nothing else changed [14][2].
Limits of current studies and consumer AI analysis
The usefulness drops fast when the video is poor or part of the lift is hidden.
Most load-distribution studies look at trained or elite lifters. So the results may not carry over neatly to beginners or intermediate lifters who are still building their motor patterns. The deadlift research is even thinner. A 2025 review found only two intensity- or fatigue-based studies with enough detail to support stance-specific conclusions [1].
On the consumer AI side, the ceiling is lower than many people assume. Top vision-language models currently identify only about 58.2% of actual form issues correctly in video-based analysis [9]. Put simply, some errors get missed, and some false alarms still show up. Smartphone-based systems also struggle with occlusion, where a plate or limb blocks a key joint from view. That makes analysis less precise on lifts with more visual clutter, like heavy deadlifts [9][14].
Video-based AI can estimate or infer some load-distribution metrics, but reliability falls off compared with lab setups [2]. It's best used as a screening tool, not a stand-in for force plates or 3D motion capture.
Conclusion: What AI Load Analysis Adds to Strength Training
Taken together, these studies point to a simple idea: AI works best as a rep-level snapshot of how load is distributed. It takes movement quality and turns it into data you can track. A coach can watch a rep and notice what looks off. AI can put numbers to bar path, asymmetry, torso angle, and velocity loss. That gap matters. If asymmetry sticks around and the bar keeps wobbling, efficiency can drop and injury risk can go up.
Each lift distributes load in its own way, so the same cue can mean very different things in the squat, bench press, and deadlift. What looks like a form issue in one lift may just be a normal mechanical adjustment in another. That’s why it helps to track load patterns across many sessions instead of reading too much into one rep.
For lifters and coaches, the takeaway is straightforward: use AI to spot repeat patterns, not random rep noise. Its limits are clear. Camera angle, lighting, occlusion, and simplified body models can all affect reliability [15][16][10]. As a screening tool, AI adds objective data to a training log. Video-based tools like CueForm AI can turn those metrics into usable cues from squat, bench press, and deadlift footage. Used this way, AI load analysis makes feedback sharper without replacing coaching judgment.
FAQs
How accurate is AI video analysis for these lifts?
AI video analysis for squats, bench presses, and deadlifts is now highly accurate. In some cases, specialized models have posted F1-scores from 0.99 to 1.00 when detecting specific execution errors.
These tools use pose estimation and deep learning to track body landmarks and bar path, then flag problems like rounded backs or early hip rise. Camera angle can still affect accuracy, but platforms such as CueForm AI use smoothing and frame-by-frame analysis to deliver precise feedback.
Can AI tell the difference between normal heavy-lift changes and bad form?
Yes. AI can tell the difference between normal mechanical shifts and bad form.
For example, it can separate changes that come from heavy loads or fatigue, like slower bar speed or a bit more joint variability, from movement issues that may lead to trouble.
It does this with pose estimation and machine learning. Those systems track joint positions and movement timing to flag harmful breakdowns, such as excessive spinal flexion, uneven bar paths, or a premature hip rise.
CueForm AI uses this approach to give personalized feedback on squats, bench press, and deadlifts.
How often should I review AI lift data to make training changes?
Look at your data through the lens of long-term trends, not one workout or one session. If you want to judge changes in your training over time, use a rolling 8- to 12-week window.
You can still use CueForm AI for quick feedback between sets or to get technical cues before your next workout. Just don’t overreact to short-term swings.